
In 2018, people taking DNA tests were measured on four proxies for IQ: education (n = 1.1 million), cognitive test, typically a super quick one ( n = 257,841), self-reported math ability (n = 564,698) and hardest math class completed (n= 430,445). Thousands of genetic variants (SNPs) were discovered and they implicated the brain and neuron to neuron communication (Lee et al., 2018). A total genetic score summarizing all four variables explained 7 to 10% of the variation in cognitive ability (implying a correlation of about 0.3), and 11 to 13% of the variation in education attainment (implying a correlation of 0.35) though that might be inflated by population stratification.
While none of the four phenotypes has a high g loading, you’d expect the total of all four (depending on how they were weighted) to have a reasonable g loading, so why the dismal correlation with genes? After all twin studies promised an adult heritability of 0.75, implying a genotype phenotype correlation of 0.87!
HBD deniers argue the twin studies gave inflated results because identical twins share prenatal effects and were not raised sufficiently apart. HBD proponents claim the twin studies are valid and the missing heritability is hiding in rare genetic variants not sampled by SNPs (single nucleotide polymorphisms).
While scientists are not yet able to predict an individual’s IQ from DNA with any useful certainty, they can predict the average IQ of a group from the average DNA of the group. That’s because error at the individual level cancels out at the group level. So while the above mentioned polygenic score (which Davide Piffer named EA3 PGS) correlates only 0.3 with IQ at the individual level, it correlates 0.985 at the ethnic group level (Piffer 2021).
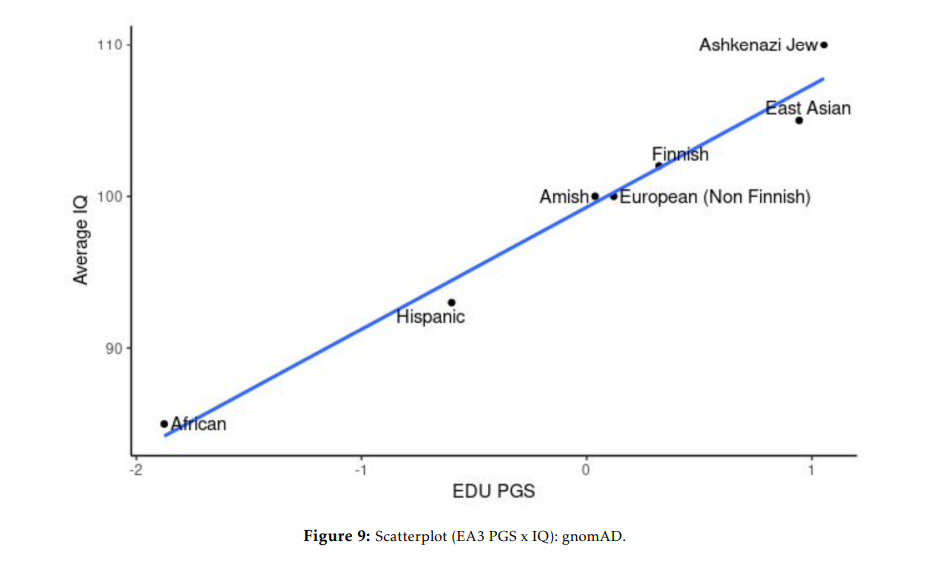
Further, the correlation can not be dismissed as population stratification unless one believes that the same spurious correlations that hold within Whites (on which the polygenic scores were built) also hold between wildly different ethnic groups reared in the developed World. Of course with only seven data points, we can’t be overly confident in the strength of this correlation if expanded to a larger group of populations, but we can be 95% sure the correlation is at least 0.9.
In March 2024, Piffer and his colleague Emil O. W. Kirkegaard studied the EA3s of 2,625 “European-ish ancient genomes” and produced a most remarkable chart

Eyeballing the above chart, I estimated the EA3 PGSs of each of the historical eras. Unfortunately, I can’t simply apply the line of best fit from figure 9 shown above to these historical eras because Piffer calculates EA3s as Z scores relative to specific data set and thus are incomparable across datasets. Nonetheless, Piffer has confirmed that Upper Paleolithic Europeans have educ-cognitive scores similar to contemporary Africans (Piffer X account, June 6, 2024) On a scale where U.S. & British whites average 100, Europeans average 99 and it’s estimated Black Africans would average 80 if reared in the First World (Lynn 2006). If we thus equate the PGS of Upper Paleolithic Europeans to be equal to 80 and the PGS of contemporary Europeans (1 KG Eur) to 99, we get the following estimates of how each era would score in today’s environment:
| Historical era (European-ish) | Estimated average EA3 PGS | Average expected IQ if reared in today’s First World (based on estimated line of best fit) |
| Upper Paleolithic | -1.6 | 80 |
| Neolithic | -0.4 | 91 |
| Copper Age | -0.5 | 90 |
| Bronze Age | -0.3 | 92 |
| Iron Age | +0.2 | 97 |
| Imperial | +0.1 | 95 |
| Medieval | +0.05 | 95 |
| Contemporary Europeans (from the 1000 genome study) | +0.5 | 99 |
Of course minor fluctuations of a few IQ points here and there are to be expected given sampling errors and should not be over-interpreted. The big takeaway is that average European-ish genetic IQ has been relatively stable over the last few thousand years.
[Update 2025-03-20: An earlier version of this article incorrectly classified 1KG as an agent genome database when in fact it is contemporary]
[Update 2025-04-26: An earlier version of the article incorrectly estimated historical IQs from the line of best fit in figure 9, which can not be done because the historical PGS were calculated with respect to a different data set]

“HBD deniers argue the twin studies gave inflated results because identical twins share prenatal effects and were not raised sufficiently apart. HBD proponents claim the twin studies are valid and the missing heritability is hiding in rare genetic variants not sampled by SNPs (single nucleotide polymorphisms).”
The “deniers” are right (see eg Bronfenbrenner on the old pre-70s twin studies). The “proponents” just shifted it because the “evidence” didn’t pan out the way they wanted it to. (We also know that the larger the dataset that there is an increased chance of spurious correlations.)
https://notpoliticallycorrect.me/2023/09/30/missing-heritability-and-missing-children/
The “proponents'” claim is also ad hoc—positing rare variants AFTER the missing heritability problem is observed. It’s a response to the discrepancy between twin/genomic differences in “heritability”, not a hypothesis based on prior, independent evidence. It’s, basically, and after-the-fact explanation to save the validity of twin studies.
(Nevermind the fatal—false—flaw in hereditarianism: that genes are sufficient causes of development and trait ontogeny. There’s also the fact that “genetic intelligence” doesn’t make sense—just computing scores and then using ancient genome to see if “genetic IQ” has increased or decreased is a fool’s errand.)
we know genes are not just lying in dirt on their own rr
that is such a stupid argument that the genes are all there are and the rest of the cell doesn’t exist you are placing as the beliefs others hold.
rr cannot accept that genes play any role in metabolic processes so must say other people are so stupid that they believe genes are lying in dirt not doing anything.
The fact is that genes play a role in phenotype no matter what rr says because metabolism exists yet he will insist others are wrong 100% inferring they believe stupid shit they don’t.
rr will always make shit up about what others believe because he cannot contend with the facts about cell metabolisms role in phenotype along with genes.
This doesn’t respond to anything I said. Genes “play a role” as necessary—not sufficient—causes, and the numerous (more than 5) arguments I’ve given attest to that.
So is the “proponents” explanation ad hoc or not?
it responds to your view that intelligence and genes have no correspondence.
If you stop saying shit about how genes don’t do anything then maybe we can discuss how metabolism leads to intelligence.
By having “correspondence” you mean mere correlation (which we have explanations for) or sufficient cause?
Are structures and processes in the brain mere correlation to genes?
proteins effect brains by the interacting shapes of the proteins because of differences in each brains protein make up.
you don’t think brains have differences in the proteins they have inside them?
what happens when brains have proteins not found in other brains?
you would know that some would function better and some would function worse
on average the better functioning brains are more intelligent
so intelligence being a mere correlation to genes is not a suitable explanation for all brains being the same. they are all not the same. there being difference as to functioning better because of differences in proteins just like any other body function is why genes increase or decrease intelligence.
Damn bro, I asked a simple question and you didn’t answer it.
“so intelligence being a mere correlation to genes is not a suitable explanation for all brains being the same.”
Who said that all brains are the same? Check out Howe et al and and get back to me.
the point is that genes can effect intelligence
so what’s the problem?
a better functioning brain is more intelligent on average
why don’t you get that?
“a better functioning brain is more intelligent on average”
Source? Did you read the references I cited below yet?
so your default response is to ask for a source of what a functioning brain is?
you don’t understand intelligence obviously
Nevermind the fatal—false—flaw in hereditarianism: that genes are sufficient causes of development and trait ontogeny.
That’s like saying the fatal flaw in environmentalism is that non-genes are sufficient causes of development and trait ontogeny. Get back to me when you clone a sheep without using DNA.
That’s not an entailment of “environmentalism.”
Exactly. Attacking straw-men is a game two can play at.
How I define hereditarianism isn’t a straw-version.
Hereditarianism is true if, and only if, genes are not only necessary causes (like all other developmental resources) but also sufficient causes (meaning that genes are special developmental resources over and above other resources). But genes are not sufficient causes (meaning, they are not special developmental resources over and above other resources). Therefore, hereditarianism is false.
https://pmc.ncbi.nlm.nih.gov/articles/PMC3262309/
^gibberish
^ valid argument with true premises (conclusion follows from the premises).
I’m more interested in the ad hoc explanation though.
Hereditarians predicted that most of the variation in IQ is caused by genes. They never said it had to be common genes, that was just the first place scientists looked. So nothing ad hoc about looking at rare variants when common variants proved lacking.
“Twin studies show heritability to be high, so there must be genes that explain this high heritability and we’ll be proven right once molecular studies get carried out!”
*Molecular genetic research gets carried out, finding substantially lower heritability, and we have explanations for the correlation that don’t involve genes (nevermind the conceptual pitfalls)*
“No, it’s <em>rare variants</em> that explain the correlation and they will bridge the gap between twin and molecular genetic SNP heritabilities!”
Yea, that’s the definition of ad hoc. Check Howe et al (2022)—they found that edu SNP heritability was 0.04 while cognitive ability SNP heritability was 0.14.
Twin studies show heritability to be high, so there must be genes that explain this high heritability and we’ll be proven right once molecular studies get carried out!
And they more or less were. The missing heritability was eventually found, though as the quality of studies improves, they might be debunked again.
Oh that’s easy. RR does that every time he gets someone to agree with him.
Race Realist could benefit from some special developmental resources.
lol
Ganzir, funny.
PP, what? Did you not see the reference to Howe et al 2022? There IS a disconnect between twin and molecular SNP heritability and we know why (and we can explain the SNP heritability without genes).
RR, how do you explain the 0.985 correlation between average IQ and average EA3 PGS among diverse ancestry groups?
We know that PGS doesn’t “port” across ancestry (the portability problem) since causal effects aren’t estimated. See the below references. Along with Bird (2021), it’s clear that main hereditarian hypotheses have been tested—and they don’t hold up. Therefore to be a hereditarian in 2025 is to believe in a delusion.
it doesn’t port across ancestry when predicting individual IQ, but it ports virtually perfectly when predicting the AVERAGE IQ of an ancestry group.
rr thinks a brain can grow without genes
that is the only way you can say differences in brain function because of different proteins don’t matter
PP, you’re wrong see “Polygenic scoring accuracy varies across the genetic ancestry continuum”. I find it strange that you only refer to 2 people on this issue when there is much better work on it that shows what I’m claiming.
“rr thinks a brain can grow without genes”
Where did I say—or even imply—this?
Yes a lot of PGS are fairly useless for predicting INDIVIDUAL phenotypes and yes they become even more useless as a function of geographic distance from the reference population. But the AVERAGE EA3 PGS is virtually perfect at predicting the AVERAGE IQ of entire ancestry groups. To make an analogy, height only moderately predicts weight (r = 0.4) and the correlation would be even weaker if we used the height-weight relationship among Americans to predict weight from height in India. However the AVERAGE height of an entire country would correlate VERY WELL with the AVERAGE weight of an entire country (0.9), because averaging across entire populations tends to cancel out confounding variables like muscle, fat, etc. Capiche?
I find it strange that you only refer to 2 people on this issue when there is much better work on it that shows what I’m claiming.
Because all the work you’re citing including “Polygenic scoring accuracy varies across the genetic ancestry continuum” are talking about INDIVIDUAL level correlations which I agree suck and suck even more when applied to distant countries
rr if brains don’t grow differently you would not need different genes to explain the functioning of brains in different ways so you don’t believe genes play a role
“Hereditarianism is true if, and only if, genes are not only necessary causes (like all other developmental resources) but also sufficient causes (meaning that genes are special developmental resources over and above other resources). But genes are not sufficient causes (meaning, they are not special developmental resources over and above other resources). Therefore, hereditarianism is false.”
I’m sure people in ancient times believed in hereditarianism. They didn’t know anything about genetics. Why do you think whatever definition you’re giving of genetic determinism is all hereditarianism?
Obviously genes don’t do anything by themselves… no physical piece of matter does anything by itself of its own “privilege”.
I mean, Ding et al literally show that as you go further away from the training data (Europeans) that PGS become LESS accurate (which we’ve known since at least 2018). They show that the correlation doesn’t exist between other populations. I’ll let you infer the conclusion.
They show that the correlation doesn’t exist between other populations.
Between or within? If you truly mean the former, citation needed.
i’ll infer a coclusion rr won’t…
europeans in europe and europeans outside of europe have a smaller average cultural distance than europeans and non-europeans.
sometimes even within europe. for example: peepee’s pipo, romanian gypsies, are farther from romanians than romanians are from irish pipo CULTURALLY.
romania has won the IMO 5 times! but maybe it was all jews like BAP. sad.
“so you don’t believe genes play a role”
“Genes play a role” as necessary resources that interact with other resources in concert to produce the phenotype. That’s the “role” genes “play.”
“Between or within? If you truly mean the former, citation needed.”
PP, you admitted that “yes [PGS] become even more useless as a function of geographic distance from the reference population.”
We know that as certain trait values increase, that PGS decreases. We know that even WITHIN the training sample (white Britons) that the same thing occurs. Thus, there is a portability issue within and between populations (which has been understood for quite a while). This is pretty basic stuff. This is why the disconnect exists between twin studies and GWAS. There are, too, a whole slew of conceptual issues as well (see Kaplan and Fullerton, 2022 Polygenic risk, population structure and ongoing difficulties with race in human genetics, box 2 page 6).
I don’t know guys, to a rational person the evidence that has piled up since 2020 (5 years, Chuck Murray’s timeframe for when the magic evidence will prove him right will happen) puts the final nails in the coffin for hereditarianism—the empirical and conceptual issues are too much for hereditarianism to be a valid paradigm.
I have two computer programs which are supposed to do the same thing. One of these programs is well-written, while the other is an ramshackle blob of inefficient, poorly implemented algorithms. If I ran the latter program on a much faster computer, it might outperform the former. Considering that one data point, would you claim that the code comprising these programs is not paramount to their performance?
Ganzir, your two computer programs represent genotypes while the performance represents the phenotype and the hardware qdte as the environment. The poorly written program when run on the faster computer may outperform the better-written program on the slower computer. But if the code were—as you say—“paramount”, then the better-written code should always perform better in the comparison. But since the faster computer compensates for the inefficient code, this shows that the performance of the code (phenotype) depends on the code (genes) and the hardware (environment and other resources) working together.
Without the code, there is no program to run (just like without genes there is no organism wince genes are a necessary component of the organism). However, how well the program runs depends on the hardware, just like how the phenotype depends on everything going as “right” as possible during development.
So I think your analogy shows the interplay between G and E—GxE. So I don’t think the analogy hurts the claim I made, I think it actually shows exactly what I meant—genes are necessary but the overall phenotype emerges through the irreducible interactions between all developmental resources.
Sorry I did not reply earlier. I did not get a notification that you had replied to me. I suppose that the system interpreted your comment as a reply to PP’s rather than to mine.
If we assume that both programs are running on similar systems, then you are right that the better-written program should always outperform its counterpart, but that is an unrealistically generous assumption. Only in a benchmark contrived to give a predetermined result would the better program be running on an Atari 2600 while the worse program runs on a supercomputer.
If a person whose genes would dispose them to have an extremely high IQ in a normal environment suffered from severe childhood malnutrition, I doubt that any hereditarian would deny that they might grow up to have a lower IQ than someone with Down syndrome would in a normal environment. That could happen, but most people in our society are brought up within a range of environmental quality in which genes account for most of the variance in intelligence. That is why I say that genes are paramount.
I am not saying that environment counts for nothing, nor that better hardware cannot make a computer program faster, nor that there is no interplay between genes and environment. What I am saying is that, if you randomly select a bunch of people in our society, most in the differences in intelligence among them will result from genetic differences. This is a practical, limited claim, not an absolute claim that E always means nothing.
Metabolic processes in brain cells do effect communication between those cells so genes can effect what proteins are in those cells as to their communication efficiency.
But you would need to show how effective the metabolism is in the brain of ancient people is connected to intelligence in that way.
Each individual is unique so the efficiency of metabolism intra brain communication needs to be shown for the individual of genes that are involved. It might not represent the true population and I have been saying this for years: you need representative samples, an average is not going to do that over the spans of time we know about (10,000 years)
We would not know the social status or conditions they had, age of death. All that’s necessary to say a sample represents that year and group.
bones are rare and billions of people have lived in Europe we never find the ancient remains.
Two and a half thousand doesn’t seem that big a sample for ancient Europe.
populations can be extremely large and diverse
500 years ago, 4 Thousand groups existed in the Americas alone. About Two thousand in north America and two thousand in south America.
4 Thousand years ago civilization had extreme dysgenic upheavals not taught in history books that killed off many smart people not in Europe. (The cataclysm) Europe did not have civilization until 3 thousand years ago. And rome 2 thousand ago was their peak.
I think the answer is more likely that the effect of one allele could be modified by other alleles, so that the genetic portion of someone’s IQ is decided by their genome in such a way that the whole is more, or perhaps less, than the sum of its parts. There are far too many possible human genomes for us to sample all of them.
You’re talking about non-additive effects (epistasis). James Lee (in the video I posted) was dismissive of that iirc.
I will check out the video, but it seems intuitively right to me. Even if the dictionary definition of a word is always the same, its contribution to the meaning of a sentence can differ depending on context, e.g., the word ‘not’:
Same definition, different effects on the sentence’s meaning.
PP, please let me ask you if I understand this correctly.
Imagine that Ethnic Group A is, on average, much smarter than Ethnic Group B. This difference in intelligence is due to hundreds of SNPs which generally increase IQ being somewhat more common in group A than in group B. Group A also has lighter skin than Group B due to one SNP. So, if we do a genome-wide association study for IQ on both groups combined, the data will incorrectly identify the light-skin SNP as making you smarter, but if we do separate genome-wide association studies for each group, this wrong association will disappear.
Have I got it?
PP, when you redacted portions of my comments, I usually have some sense of why you redacted what you did, but redacting part of my quotation of something you wrote ???
Or are you supposing that an SNP might be more common in members of Group A than in members of Group B, and Group A tends to live in an environment which lets them reach an IQ closer to their genetic potential, so the Group A SNP could incorrectly be associated with higher IQ?
Or even that the same effect might happen if Group A, for example, values education more highly than Group B, and therefore that members of Group A tend to reach a higher education level than would members of an IQ-matched sample of Group B?
Both your examples are valid. One way to avoid it is to see if you find the same correlations among siblings. Here’s a good interview on these topics:
Yea good point. Two main “HBD” hypotheses tested—the effect of “European variants” in admixed populations and within-sibling heritability. Both DIDN’T go the way HBDers hypothesized.
https://www.nature.com/articles/s41588-022-01062-7
https://www.biorxiv.org/content/10.1101/2023.08.08.552281v1
https://www.nature.com/articles/s41588-023-01338-6
AND james lee thinks genomic prediction will never get any better than what he got which was pathetic.
the missing heritability was never there in the first place.
but peepee will just keep [pp redacted personal attacks by people who have no argument because if they had one they’d be making it, St. Patrick’s Day 2025]
sad.
notice that IQs over 195 are impossible given peepee’s precious bell curve.
they’re only possible with the old mental age vs age definition.
but then very high IQs would only be recorded in chirren. never in the chirren when they grew up.
IQ = LOW IQ
= SAD!
bell curve maximum IQ (with 8.2 billion pipo on the planet) = 195.
OMG!
SAD!
Imagine all tape measures were sold out so we no longer had the ability to measure height directly but we could still rank people by the highest shelf they could reach. And we knew, from back when tape measures did exist, that American adult height had a mean of about 5’7″ with an SD of 4″. Then we could use the bell curve to assign the tallest adult in America a height of +5.66(4″) + 5’7″ = 7’6″
you can have any bell curves you wish 1 to 200
you just need to adjust the number “e” to a different setting given the population
mine is 2.355
if you do use e tho
the mean becomes 94 and the maximum is 186 for 8.2 billion population
(I don’t know what this does to the SD?)
I am pleasantly surprised to see your topics of interest diversifying into commentary on the deterioration of American manufacturing
To think that all intelligence is is a blob of Jell-O that cannot be effected by Genes is harshly mentally deficient on those that believe it.
No, that jello can be effected by genes like any body parts.
so this is how it happens:
the brain has wires that connect
when they connect this is the bandwidth for which they can intake and process sensory information.
by this I mean to rewire themselves, to integrate and take in more and more, but like having five fingers to grab with you cannot go beyond a limit in this bandwidth.
things can get gunky if the dendrites grow slower than sensory information is took in.
and this can happen if you have the wrong set of proteins that limit growth to not be the same rate as sensory input.
dendrites must have the correct kinds of proteins to function. So to the glial cells that create the white matter.
it also means your thinking as in hypothesis creation needs to be bigger as in you need to hold ideas and work with them in such a way as to see the correctness of them. This is a loop where long term memory is combined with executive function in rehearsal.
once you have memory all wired up then those that can self change their memory are at the greatest advantage in intelligence above other’s. The rate of change all together of many thoughts at once.
bottom line is that proteins allow a rate of change in different brain areas connected up to be what they are. Genes happen to be hard coded for this rate of change in brains.
So I was thinking in my sleep and came up with this:
Variants of genes can make brains function better as I said that the rate of change matches the sensory input and the holding in working memory of multiple steps in a problem because when you look at it, it all relates to growth at the cellular level.
The concentrations of a protein produced by a cell in relation to the function of that protein can be efficient or less that efficient.
This is because a brain is trying to model the world as effectively as possible and get what it wants by understanding different ways of doing things. So if you have a way of holding more information in the brain as to functioning better you have greater intelligence.
This includes having greater perception which happens when you’re feedback is accurate. The axon wires are sending signals to the sensory areas and correct themselves when they fail at timing it correctly. The density of dendrites is important then for correction and density can only happen is the chemicals are being coordinated at the speeds they need to be i.e. protein efficiency. A faster brain has denser dendrites. Which happens because of blood flow, waste disposal, structural integrity, and growing connections when it needs to. All can be attributed to protein differences in healthy individuals (enough food and water and no psychological abuse)
Memory that create bigger and better models in fact use chemical energy so good that they correct errors at the smallest scale the fastest for some people and is why the density is so high in the entire brain.
Subcortical structure is important not just grey and white matter but we need to keep in mind that all growth rates are critical for evaluating intelligence.
Density models of brain wave fluctuating may be used determine the way metabolism is effecting a persons intelligence. If they have deficiencies or not and overall brain patterns.
with different proteins a brain can function worse or better
rr doesn’t get this
i mean I have seen both extreme genius and extreme mental retardates, are you telling me that this is cultural, I think not
i saw a guy that runs a business at age 24 who read papers about genes and is now servicing thousands by his research. I cannot read fast or do math fast but I can tell when others can. CEO type people are in the top 1% and yet rr thinks no on can be smarter than the average.
i am not saying CEOs are the best, I am saying that I can tell when people can read books and science papers really really fast. That is how they can start business like it’s nothing to them.
i think that I have been seeing why my brain stopped functioning good. And it was because I pushed it to far beyond its limits. So I stopped trying to do the really hard stuff and did more intermediate things and my brain is beginning to function better.
i have been focusing more on control of my body. That is to be be more aware and not as impulsive or anxious.
instead of just being in my head I am looking at myself through interception.
cleaning and organizing helps too.
–
the main point is that a better functioning brain requires looking inside with executive control.
not trying things too hard
keeping your room/house clean
sleeping
not worrying
eating
it all fell in place recently
i had things to do at my level and I got them done so I feel better
functioning better is the main goal so I need self control
this will not make me beyond some people in intelligence but it will make me go back to my optimum if I continue far enough with it
RaceRealist: After those insults last night, I had a minor change of heart and decided that I should give you the time of day for once, but it is impossible for me to critically analyze your views without thorough knowledge of what they are and why you believe them. Whenever I have taken the piss at you, it has been because I believed that my views on the topic under discussion were supported by both evidence and fundamental theory, and therefore that anything which contradicted them must be wrong. If you know that 2 + 2 = 4, then you can laugh at anyone’s proof that 2 + 2 = 5 without reading it, yet I suppose that there is some chance, however small, that I am the one claiming that two and two make five. Could you link me to anything like a prolegomenon to your anti-IQ and otherwise anti-Pumpkin Person views, or, at least, a summary of what those views are?
“After those insults last night”
I can take a joke. I thought they were funny (and witty).
Here’s a summary:
I think that hereditarianism is conceptually empty. And so, before we even get to the empirics, it doesn’t event get off the ground. Even being extremely generous to their claims/ideas/theories/speculations, hereditarianism continues to fail. They may point to things that we know are true and continously “replicate” as “proof” that they are right, but it’s no risky, novel prediction (just truisms that are already known).
I just look at what Galtonian views have wrought, and seeing this new-age hereditarianism could bring society down the same path that we went down in the 1900s. Thus, due to the conceptually/empirically empty paradigm of hereditarianism, and due to the fact that such views could bring undesirable consequences (since such views are based on a falsehood of humans and their traits), we should not accept their utterances as true, and we should argue against them as much as we can, even the “lite” views that may seep into the mainstream.
you do not need to know anything about old paradymes to know that intelligence exists.
rr has always attacked people for believing intelligence exists and not treating them as individuals but instead grouping anything to do with intelligence as “hereditarian”.
millions are spent on current science we know works so rr is just a troll with nothing do but attack old ideas not connected to what anyone actually believes today.
because he was into white supremacy he need this distraction to attack others on intelligence research having nothing to do with if intelligence actually exists or if people believe the old paradymes or not.
Treating people as group stereotypes is how white supremacy people think.
old habits die hard for rr calling everyone hereditarian
What I said isn’t wrong though.
“millions are spent on current science we know works”
Source?
“After those insults last night”
Sure, but my intent when writing them was too mean-spirited for them to be mere jokes, and I felt bad enought about it later that I decided I should at least try to take you seriously.
For a moment, forget formal science and studies and genetic theory and so on, and just look at how people resemble their relatives. I think you can see that behavioral traits are transmitted from parent to offspring, albeit imperfectly. For an even better example, see how each twin in a set of identical twins tends to act just like the other one.
One of my favorite quotes, not just on IQ or hereditarianism but rather about anything, is this gem from Lewis Terman [source]:
In my view, intelligence research in any form, be it classical psychometrics, genomics, or brain scanning, only serves to formalize this intuition, grant it an empirical basis, and allow that basis to be developed into insights which are not so obvious. Think of how Bertrand Russell and Alfred North Whitehead exhausted hundreds of pages in their Principia Mathematica before proving that 1 + 1 = 2 (and please do not overextend my analogy by retorting that Gödel demonstrated the impossibility of their goals). Once you see that throwing a ball up in the air results in it falling back down, only then should you occupy yourself with mathematical formulations of the theory of gravity.
If by, “the same path that we went down in the 1900s”, you mean something like Aktion T4, or at least the American eugenics program with its forced sterilizations, then I agree that propagation of hereditarian views among the hoi polloi could lead us down that road again, but opposing hereditarianism for that reason is like opposing nuclear physics because of the bombings of Hiroshima and Nagasaki. Regardless, hereditarianism has little mainstream acceptance in any form, diluted or distilled, and I suspect that the most hereditarian views you are likely to find amongst the general people are the unquantified, unscientific, naive hereditarianism of conservatives who simply see that traits are transmitted from generation to generation. Can you imagine any remotely mainstream public figure saying that genes cause crime, or that any race is in any way genetically inferior to another?
rr won’t treat you as an individual unless you agree with him or have a high enough intelligence.
that’s what former white supremacy people do when “they change their minds”
Another moronic blog post full of autism on steroids. You really think theres been no genetic increase in IQ in thousands of years? Really?
What the hell are you working with? Either the 9 correlates are not enough or the EA3 in kirgegaards paper is based on 1 or 2 bodies.
Why do you need me to say this? Are you purposely pretending evolution doesnt apply to humans to protect beloved?
It’s actually you who sounds autistic. Why would you even think we’re genetically smarter than Iron Age people? The whole point of culture & passing down generational knowledge is that it allows us to advance without changing genetically. Humans are the only animal that can do that. Do you think Einstein would have come up with relativity if he were raised by apes?
Good points, PP. I agree with this (that sharing and passing down culture explains this, eg Gould’s argument in Full House).
It’s actually you who sounds autistic. Why would you even think we’re genetically smarter than Iron Age people? The whole point of culture & passing down generational knowledge is that it allows us to advance without changing genetically. Humans are the only animal that can do that. Do you think Einstein would have come up with relativity if he were raised by apes?
With puppy I always have to read his posts backwards not forwarfds like other bloggers.
The answer is always : beloved is precious, then insert reasons for it.
This post is another CNN level drivel in that direction that uses buzzwords to throw off gullible readers like Anime.
you are stupid to think I am stupid
of course more evolution happened
but it was an adjustment to culture on those who were elites and peasantries
farming increased IQ for farming
and metal ergy with metal ergy
those with swords killed those without swords
reading existed for a short time
what the fuck does this have to do with terms like “beloved”.
stop be stupid and racist and bullying twords everyone, it has nothing to do with science
“of course more evolution happened”
What’s the argument that we can infer this based on just PGS?
Youre dead right anime. This post has nothing to do with science. Its religion.
https://x.com/MungoManic/status/1901856144202596475/photo/1
The possessor of this skull would be able to fit in with the modern population, if raised in a modern household. Just give him a North Face Jacket and some khaki pants, and he’d be ready to work as a receptionist at your local DMV. It would be just like the movie Encino Man!
Puppy genuinely thinks if you brought a caveman into a time machine and into the modern world he could be retrained as a programmer or an engineer
Pill thinks if George Soros were raised by wolves, he’d still be a finance expert
So you think evlution just froze for thousands of years? Are you stupid? Why would it freeze?
It’s been 7 million years since we were swinging from the trees so 3000 years is a blink of an eye in evolutionary terms. Also Gould’s Punctuated Equilibrium model predicts sudden bursts of change followed by long period of relative stasis.
he COULD be is a FAIR-ER way of saying it.
in reality he COULDN’T be except by making him a slave.
peepee thinks being a slave is COOL.
sad!
Yet an eternity compared to the timespans which artificial selection by humans has proven that evolution can happen over.
of course, yes racist [homophobic slur redacted by pp, March 19, 2025]! with the right training and opportunities, anyone can be equipped to excel in any field. Whether it’s in science, technology, business, or the arts, the ability to learn and develop skills is all around. All people, regardless of their background, race, or ethnicity, have the capacity to acquire knowledge, build expertise, and contribute meaningfully to country. Basement dwelling, flag bearing, nazi punk ass mofus like you cannot comprehend that fact in your little mind. Get back to going ass to mouth with your butt buddies in your little nazi forum stroking each others 0.5″ peckers!
Who is this guy? He makes a lot of sense.
Yes, inferior brown person, “Marxists” like you are a dime a dozen. That’s why you’re known as “midwits” and anyone with a serious theory of intelligence or biology or the universe ignores you.
“with the right training and opportunities, anyone can be equipped to excel in any field. Whether it’s in science, technology, business, or the arts, the ability to learn and develop skills is all around.”
translation: Give them money, give them free stuff, give them power, if they fail, it’s also your fault because of history, I’m a dumb brown person.
Also why are anti-White Nationalists always obsessed with their dick size? Why do they claim “body positivity” and then shame men they think have small penises. Lmao.
I can’t “bear a flag” and be a “basement dweller”.
Yadda Yadda Yadda! Same old canard! free money, free food??? what else!! If you’re going to act like a turd, go lay on the yard:) what about the structural racism deeply embedded in the society and so many countless barriers that have been a major roadblocks for social mobility, which you conveniently ignore, you limp-dicked basement-dwelling cunt! Certain communities are set up for failure thats what your nazi punk regime want to be at the top continuously playing the victim game, being an oppressor! Thankfully, people are able to see through your BS and your clamoring for dominance again, which will never happen. Get back to watching interracial porn which you secretly claim to hate living in your mamas basement and blowing your punk ass nazi buttbudies cock in your gay bar, dipshit faggot!
Didn’t read, you’re too stupid to be blessed with that.
BECAUSE unlike ants and other such eu-social insects…
HUMANS combine…”fuck off! i don’t wanna do your shit!” + your SHIT!
ants + homo sovieticus + actual humans.
humans are THE social species. BUT at the same time it DENIES its “sociality”.
it is the dialectical species.
So, me and the Bot’s hypothesis is correct. Civilization increased genetic IQ.
After Agriculture it seems genetic IQ increased 10 points.
Wow even Melo accepts evolution. Wow. He might get banned from BLM for this.
reminds me…
that’s the thing…
SLAVERY is NOT what black folk think it is.
man is THE social species…
BUT UN-like ants men are also individuals.
reminds me of hedges’s prison students. i believe him. prison can be the best thing that ever happened to you. or just grinding you down to nothing.
RECALL the NT commands that one see prisoners.
I needed clothes and you clothed me, I was sick and you looked after me, I was in prison and you came to visit me.’
these fucktards like peterson CONVENIENTLY forget that ENGELS was a rich goy…
AND so much else.
What is this guy saying??
Punctuated equilibrium rests on the fossil evidence which is by its natuire sparse and punctuated dumbass. If you had a fossil for every single year of various organisms and a huge sample, you would see tiny, but gradual change.
This is Darwin’s theory.
The jewish theory is just bs to pretend blacks are the exact same as everyone. Gould probably laughed at people that believed him.
But it doesn’t imply that dumbass. In fact I’d argue that after 25 million years in the tropics, leaving Africa & entering ice age Eurasia was one of the biggest punctuations ever.
You dont even understand basic evolution. Youre just embarrassing.
no you don’t understand. Why would evolution always go at the same speed?
BECAUSE THATS THE THEORY OF EVOLUTION DUMBASS
So by your logic all races would be equally evolved because all have been evolving for the same amount of time.
Obviously it depends on what either of you mean. Natural selection obviously works constantly, but the specific pruning process on populations, or traits that arise or spread can potentially happen at different rates. It all depends on what you’re considering your basic unit of measurement!
lurker is a gay mossad agent.
SAD!
^Literally a guy who loves brother wars and degeneracy and can’t bother to control his drinking to provide a good example for his fellow man.
Well I have to give it to trump. i might disagree on most of his policies, but he definitely follows through unlike 99% of politicians. [redacted by pp, March 19, 2025]
yup, he’s the best President Israel has ever had.
If I knew you were this anti science i wouldnt have come here
Sorry to hear that. Will you be leaving soon?
I’ve been growing out my hair and my mustache for over 8 months now and I am such a chad.
Gotta keep the beard thinner because of the Asian genetics, but holy hell do I look suave.
I’m gonna start wearing flannel soon.
^^^SAD!^^^
melo is becoming a castro clone.
SAD!
I’m starting to look like Kurt Russel in Guardians of the Galaxy 2, but with a mustache….and I’m Asian.
On the other hand, for the last couple of months I have been going for only a small bit of hair on my chin. Proper maintenance of the full megabeard I had since I was sixteen is too inconvenient.
If I was more optimistic, I could believe in a variation of the “lizard people shadow government” conspiracy theory.
But more than likely there is no outside force trying to ruin the world, it’s just us lol.
I don’t remember being in charge of the federal reserve.
You think the federal reserve is ruining us?
I don’t think it’s the fed “alone” ruining us, but they obviously work with/for the people who do. On average, people have something to do with their own problems, but certain people/groups/systems definitely deserve more responsibility. That’s one of the points of Marxism, I thought.
“I don’t think it’s the fed “alone” ruining us, but they obviously work with/for the people who do.”
Lol, what do you think the Fed is doing that is ruining us?
You can always tell someone isn’t a serious person when they try to frame immigration as an “invasion.”
No, Trump cannot ignore the court and deport people without any kind of due process.
But that doesn’t matter to you cucks. You literally just parrot whatever fake news tells you to believe. You don’t have independent thoughts. Nobody batted an eye when the judiciary struck down Biden’s attempts at student loan forgiveness but now when you’re on the other end of it suddenly you think the judiciary has gone too far.
People with high social IQs see through this trash. Trump is not charismatic, funny, or convincing to intelligent people.
Why don’t you try bullying a poor boomer or a female instead of people who literally don’t care about any of this?
“or a female”
Lol.
RR, Mugabe, and Melo thinks we should give infinite resources to those with Down Syndrome or other genetic disorders because if you extend the amount of resources given infinitely (like in calculus… to the limit!) you can acheive equal outcomes. Like every armchair biologist/psychologist/philosopher, surely if they applied these ideas in their own created country where they took a bunch of these people in as the main population, it would become no. 1 in GDP and technical and cultural achievements.
Or maybe they should stop being racecucks and let more intelligent and rational people deal with the hard problems.
I definitely agree that throwing money at a problem won’t solve it. Only addressing the material will only solve half the problem. That said, it’s all intertwined.
[insert Brave New World epsilon joke here]
Lol, if only there was an actual deep state. Then maybe this nightmare would be over.
How does it feel to get played you cucks?
https://www.youtube.com/watch?v=3Eu80w5W2GI
This video is all the evidence you could ever need for hereditarianism. Notice how the identical twins are nearly fungible both physically and behaviorally. Do you really think that is because they grew up together?
My guess is RR would abort a baby with downs if it got screened at the hospital for it. But then would say with a straight face the next second genes dont matter becuase of beloved, beloved. Dearest beloved.
Honestly, the more anti-hereditarians point out the possible effects of the environment (any physical or mental interaction that impacts development… which is theoretically all of them from zygote onwards) and the stochastic nature of physics at the quantum level combined with the necessity of genetics to interact with the rest of the organism, the more it seems like genetic or ancestral heritage is magically guiding development.
In the process of trying to destroy the hereditarian’s physical explanation of development and replace it with an irreducible environmental-genetic interaction theory… the more they make development look like it was intelligently designed from outside the environment by some physically and temporally transcendant omniscient creator.
Teffec basically made that claim in his guest post here.
I doubt that any hereditarian would claim that any environment counts for nothing.
“and the stochastic nature of physics at the quantum level combined with the necessity of genetics to interact with the rest of the organism,”
I suppose they think quantum computers do not need to be programmed.
Of course I agree, but all the arguments RR and his environmentalist comrades make are basically so all-encompassing in the way they prevent any possible order one could find for directing development, leading to impossible to predict GxE or system interactions with no specific relation to survival (ToNS does not direct trait fixation) or predictability from ancestry (the whole environment is inherited and directs development in a completely opaque and presumably stochastically random way)… that basically, it causes one to doubt they believe in nature being able to produce anything of order while they’re also unable to explain how life, humanity, evolution, and the universe is so ordered (because they’re physicalists or atheists).
That sentence was long!!!
I bet I’ve spent more time around twins than anyone here.
And, in a way, the system does guide development and it can and does take into account any kind of effects that go wrong (eg genetic compensation). Development is must more interesting than a hereditarian model would assume.
Ok back to basics.
A positive statement in science is an empirical or real life observation and is an attempt to explain or predict something in our world.
A normative statement in science is an opinion about what should happen or the best policy based on scientific findings or research. E.g Climate change regulation etc.
Puppy when understanding the world the epistemology is always to consider positive statements first before making normative statements.
But unfortunately, you RR Melo and other low IQ people ‘feel’ the need to put normative reasoning first before making positive statements.
An example of this is:
Everyone is equal and should be treated equal and I you know, made to be equal.
….Therefore, it follows that evolution made everyone equal.
I’m not going to analyse why you ‘feel’ the need to drive for equality which is complicated. But the essential thing is that you need to put positive statements first if you want to make normative statements.
If I shared your political beliefs it would be:
Evolution didn’t make us equal. But we can understand it better to engineer more equality more efficiently.
Thats all I wanted to say because this blog sounds like a religious blog more than a science blog sometimes.
When a person puts normative reasoning first it warps their own views of how to understand people.
So if I make a positive statement: Jews are more intelligent than gentiles.
You interperet that as a normative statement that I ‘believe’ in jews when Im just making an empirical observation.
You have to escape the medium IQ ‘trap’ of making normative observations first before positive statements. Once you make positive statements, then knock yourself out on normatives. As you know I make a lot of normative statements like you 3 clowns. But my understanding of the science, in my opinion and you can ask Marsha to confirm, is about 3 or 4 SDs stronger because I want to know the truth before having an opinion.
AFAIK, punctuated equilibrium belongs in the ‘religion’ category and Darwinisim belongs in the ‘science’ category. Most biologists and science experts believe in the theory of evolution.
These quack theories you hear from useful puppet RR from Fodor, Gould, Ben Shapiro, Jeff Zucker….theyre not accepted by scientists even though many scientists do agree about equality and wanting to be nice to beloved.
Look, beloved.
See beloved.
See beloved for who beloved is.
Not what you (were made to) wish him to be.
Do Fodor, Zucker and Gould like beloved privately? No they don’t. Trust me. They don’t. Hahaha.
Crocodiles have been around hundreds of millions of years. They live in a equilibrium as do many other organisms.
Only when the environment changes do organisms need to change because that is when variation becomes an adequate adaption strategy for survival.
So it depends on the rate of environmental change.
Neanderthal existed a million years because the ices age did not change them for them a long time.
Modern Human adaptation to the ice age happened when the ice melted 13 thousand years ago but periods of 20 thousand years humans in the ice age before then were adapted to the ice increasing. (Ice ages influenced global weather patterns not just northern patterns)
Change in a darwinian sense happens this way. I have no idea how fodor etc. can say punctuated equilibrium is not darwinism? They want to be special I guess.
But crocodiles have changed a lot. In the Jurassic period they were much larger and spent a lot of time on land. They also sometimes had feathers I think.
Then the asteroid hit and caused a lot of cosmic dust and matter to form a massive cloud above water. So crocodiles (or their ancestors) adapted and became able to spend longer periods underwater and the feet changed into webbed and so on. They also become much smaller because there wasnt nutrients perhaps in the sea ecosystem post meteor.
Darwinism happens every single generation. And in my personal opinion on even a daily basis with epigenetics and molecular changes to toxins, environment and physical pressures.
Punctuated equilibrium [redacted by pp, 2025-03-31] not mainstream in any way except very recently and only then by liberals searching for reasons why evolution never applies to humans.
But crocodiles have changed a lot. In the Jurassic period they were much larger and spent a lot of time on land.
That’s an incredibly small change in 65 million years. Any four-year-old would still be able to immediately recognize them as crocodiles.
Google pictures of ancient ‘crocodiles’ and compare. Crocodiles didnt exist back then.
That thing is basically a t rex in the water.
no it’s just a very big crocodile. I don’t know why you’re arguing that evolution always has to go at the same speed. The speed is largely a function of how intense the selection pressures are. For example if suddenly all groceries were on the top shelf, average height could increase a foot in just one generation as anyone who wasn’t a giant starved to death. On the other hand, if tall people had just a 10% better chance of surviving in combat, it could take 2 million years for height to increase a foot because combat is relatively rare and not always fatal. Capiche?
Something like IQ probably had stabilizing selection. If your IQ was too far above 100, you’d probably be too nerdy to get women or protect them if you did and your wife & kid would probably die in childbirth because the baby’s brain too big. If your IQ too far below 100, you’re too dumb to hunt or farm and thus starve to death. Thus European IQ stayed around 100 since the iron age, a major exception being Ashkenazi Jews because per Cochran’s theory, they were banned from owning land and thus could only survive by succeeding in g loaded occupations (money lending). The fact that they have neurological diseases (Tay Sachs) is evidence that their IQs evolved unusually quickly, before natural selection had time to iron out the kinks.
Youre so painfully dumb I sometimes wonder whether youre trolling me. Of course the environment can cause faster mutation or selection or epigenetic drift…and thats exactly what happened to humans repeatedly. No environment in more severe and complex than dealing with other humans.
Well all humans had to deal with other humans so why do you believe in race differences? What separates the races is the NATURAL environment.
How did I miss this? What a fucking idiot.
Obviously, it does not make sense conceptually to say that genes cause phenotypic expression in a vacuum, but empirically speaking, you can take two people and try to say whether the differences between them is due to differences in genetics or environment.
However, such an endeavor is nearly impossible when it comes to humans because the mind introduces a 3rd variable that adds infinitely more complexity.
And with dumbass in charge, we all know that our scientific progress and collective IQ will only get worse over time. China is obviously going to be the next superpower and they’ll be the ones to crack the code.
AND IT’S ALL MUGABE’S FAULT!
Pumpkin is right they’re genetically superior.
“the mind introduces a 3rd variable”
maybe?
mental performance is still something we can compare between individuals
not knowledge tests but concrete stats like copying or remembering data (visual or verbal) in the present moment.
i am trying to learn math but I forgot things so if memory is good you will have good performance and if you are not being abused physically or psychologically ones memory should in all terms show ones ability to learn bigger chunks of data.
so genetics still might be possible to study as to a persons intelligence with relativistic measures. You might simply need a thorough history taken of large amounts of subjects and those effects on memory.
its not like labs cannot scan brains for structural and functional form and write down all the information. It probably has been done. At places we would not have access to because we are not smart enough to work there.
only the problem is that they have the results and as it is not available to the public to use based on ethics standards they set up for patient treatment. They cannot profit off such research unless they use it for other research.
Knowing peoples genetic IQ doesn’t give them much money but can be used in other ways medically how people can purchase personalized drugs for them alone. It will be cheaper to research and make them with genetic screenings.
“mental performance is still something we can compare between individuals”
Intelligence is just one aspect of the mental, and we can measure one’s intelligence, but measuring the effect the mental has in total over other mental constructs or our external environment as well as how that in turn affects population genetics (which obviously there is a feedback loop involved) would be an EXTREMELY difficult endeavor that our best Scientists, let alone HBDers, will not be able to solve for a long time.
And that will continue to be the case as long as you morons keep voting republican.
^ITT Melo thinks ethnostates with slave camps and neutering for lower IQ people, regardless of how abusive they are to their own populace, accomplish more civilizationally than globohomo usury hedonist multiracial nations that give free handouts to the lowest IQ violent populations and wealthy international corporations, politicians, and bankers
Actualy mugabe believes in beloved as well. A lot of people do. Its a very normal thing to believe the sayings of Master.
Chinese people believe in the CCP.
Russians believe in this or that.
Muslims in this or that.
99% of the beliefs of people all around the world keep them down in a hole begging to be hosed.
Neitszche was very important in saying that for the first time.
marx said it like 50 years before nietzsche FUCKTARD! it’s called “ideology”.
nietzsche was the OG castro clone!
what a fucking CLOWN!
pill’s IQ is too low to comment. sad!said:
DUMBASS!
you’re talking to the wrong guy!
i’m an american and the only thing my country does right is freedom of speech. in every other way it sucks.
what do you mean “believe in beloved”? believe nigeria could be just like japan but for muh racism?
i OPPOSE affirmative action based on race. i ALWAYS have.
but in terms of immigration aren’t the very best of nigeria better than the average from europe? of course they are. or does pill believe that in a few generations these clever nigerians will become like average black americans?
(((pill))): so if you had a wyguy, a chinaguy, a jewguy, and a blackguy which one would you want to take the SAT for you?
mugabe: if that’s all i knew about them i’d choose the jewguy. but if the blackguy had taken the SAT and scored perfect i’d choose the blackguy. DUH! just like i’d choose the irishguy or the russianguy for my drinking games team.
(((pill))): shut up RACIST!
mugabe: “racial profiling” is rational when you know little or nothing else about the person except for his race.
rr: shut up RACIST!
[redacted by pp. March 22, 2025]
why is there a redaction at the bottom?
because a certain kind of socialism plus you accuse Sailer of what Trump does
7′ tall serbians don’t make the best gymnasts. SAD!said:
ashkenazi jews as a whole score higher on at least one factor of IQ tests (the verbal factor) than wygentiles. blacks as a whole score lower on all factors but especially lower on the visuo-spatial iirc. chinapipo outside of china score higher on at least one factor (the visuo-spatial factor) than wygentiles.
those are just FACTS.
but what does that say about muh genes n shit yo muhfugguh n shit?
as rr has painfully demonstrated, not much!
twin studies are gay and retarded and PGS has EPIC-FAIL!-ed to reproduce them.
the flynn effect is bigger than the ashkenazi wygentile gap.
israeli jews score about the same as irish pipo.
(((pill))): no but muh racism and muh normative vs positive n shit.
mugabe: no but the problem is you’re just a dumbass! hereditism and blank-slatism are BOTH FALSE! there is an AUFHEBUNG! this might be called GxE-ism.
take borzov. supposedly he was NOT very fast when he was selected by the soviet system. he was trained to be fast. AND the same was true of asafa powell. jamaica cares about the sprints like nobody else. AND this even though its first world class sprinter was donald quarrie in the 70s.
take obesity. take diabetes type ii.
the question is: what is the POTENTIAL given the best environment.
comparing two genomes. trying to determine which is genetically superior. ONE natural comparison is: over all environments what are their maxima? which one has the higher maximum?
what you will find is this brings pipo closer. but it does not make them equal. NOT in the case of physical traits like height WHICH HAS BEEN SUPPORTED BY PGSs.
in the case of things like adiposity, blood pressure, risk for CVD, etc. the EVIDENCE is the POTENTIAL is THE SAME for everyone.
IQ is more like these than it is like height!
all professor shoe could say was: but i think muh qualitatively different n shit.
mugabe: why? he had no answer.
Your comment is awaiting moderation.
re spatial ability; On a scale where all American kids average 10 (SD =3),Japanese kids in the Japanese standardization of the WISC-R averaged 14.2 on Blocks and 11.4 on Object Assembly. White Americans averaged 10.4 and 10.7 respectively.
I sincerely wanted to read Mugabes comment. But when he said RR is right about genes I stopped reading. Another religious nutcase.
but when he said i said rr was right about genes i concluded he couldn’t speak english or was just making shit up like his master personality does.
SAD!
for THE TRAITS of adiposity, glucose tolerance, sprinting speed, etc. there is a HUMAN CEILING, a maximum for all humans under all environments…a human will never be able to run as fast as a cheetah.
so if usain bolt had been trained like borzov he would NOT have been THAT much faster. BECAUSE bolt is already close to the HUMAN limit.
the bermuda data seemed to prove that the black POTENTIAL is equal to the wygentile. BUT in fairness to the racists, bermuda is by some measures the richest political territory on earth.
EXAMPLE: take a pima indian or a polynesian and feed him a whole food vegan diet and he won’t become obese and he won’t develop diabetes and he won’t drop dead from a heart attack when he’s 35.
feed some pipo the worst diet ever and they will still be thin and healthy.
(((pill))): see muh genes n shit muhfugguh.
mugabe: but given the right environment they are EQUALLY healthy!
It’s intellectually dishonest to ignore Lion’s rebuttal to your Bermuda argument
What was the rebuttal?
there wasn’t one i’m aware of.
peepee is just LYING again.
ALL lion did was claim the red legs were half black and looked retarded.
ONCE AGAIN PEEPEE JUST MAKES SHIT UP AND CLAIMS IT’S A FACT.
PEEPEE NEEDS TO APOLOGIZE!
lol you’re confusing Bermuda with Barbados. Alcoholism is sad.
^^^NO YOU FUCKING AUTISTIC RETARD! THE WHOLE POINT WAS YOU ARE CONFUSING BERMUDA WITH BARBADOS! BECAUSE THAT WAS THE ONLY TIME LION SAID ANYTHING THAT WASN’T GAY AND RETARDED.
YOU! YOU! YOU!
RETARDATION IS SAD!
LOOK UP OUR EXCHANGE REGARDING THE RED LEGS!
and you will find:
AS IN THE NON-EXCHANGE ABOUT BERMUDA, I WAS RIGHT LION WAS RIDICULOUS!
IQ is not like the “risk for adiposity, diabetes, high blood pressure, and CVD”. Those are simply relative to one’s body/organ size, function, and the inputs. Intelligence is more like how much food can one digest or comfortably/safely eat. The bigger body with stronger, larger organs will be able to take in more, but with the right set of variables, you could keep increasing this potential.
So it’s more like the combination of height-like genetic potential and relative environmental input. You have differing potential ranges (that may even change over time), not just the same potential which is reached by a different range of inputs. Rather, it both has a different range of output and a different range of inputs depending on the person. I think that’s how most psychometricians would view it.
south asians in the US have horrible rates of CVD.
but in india only the rich have a problem.
this was even noted in the 19th century raj.
(((pill))): so muh genes n shit.
mugabe: NO! it just means south asians living in the US need to be more careful about their diet and exercise or they’ll keel over. BUT if they are “more careful” then they can be EXACTLY as healthy as any american.
it was on our PBS series NOVA and some south asian woman who looked thin vs some fat ass wywoman.
they had their body composition measured.
AND it was the same!
meaning the wywoman just had gobs more muscle.
Yes the gap in fat-free body weight between white men & South Asian men (even in the First World) is about 1.94 SD:
the whole idea of “fitness” is defeated by humans.
if one HUMAN’s goal were to have as many chirren as possible, he would succeed in having lots of chirren.
even if he were stupid and ugly.
BECAUSE he’s NOT competing. this is NOT any actual human’s goal unless he’s the richest autist ever.
SAD!
It’s not the non-human’s goal either. The actual goal is to get resources (money), fame, love, sex because these are the things that prehistorically increased the odds of replicating genes & even today are the things people are obsessed with
why doesn’t elon musk have 1 million chirren ?
what a LOSER!
Musk sounds so dumb when he talks:
the US, like ANZ, used to be british. not white. british.
AND wypipo hate each other and kill each other by the tens of millions.
so as soon as the US stopped being british it was doomed to become like brazil.
SAD!
“huh-white nationalism” is gay and retarded because american wypipo are so NOT alike. all they share is broad geographic origin, in europe. they share no culture.
The problem with white nationalism is whites (much like Indians) are arguably not a race but a mix of 3 different races.
The problem with white nationalism is that white isn’t a fucking nationality.
^Maybe but the term makes sense when comparing Whites to West Africans or South Africans, Indians, East Asians, Amerindians, or Aborigines. Especially in regions of the world where most of the Europeans come from Western Europe.
mugabe: it’s NOT like there’s not a population of pipo who are retarded and for genetic reasons. pipo with the downs have a range. but 100 is the highest. and microcepahly the same.
this whole bs-ery comes from the extension of binet’s distinction to normal pipo.
the differecne between a very high IQ person and an average person is NOT the same as the difference between an average person and a retard.
OR IS IT?
peepee has never answered!
It probably is. But comparing to Downs Syndrome people is misleading because they have a disorder. They’re not the equivalent of a biologically normal person with an IQ of 50. A better comparison would be Homo Erectus.
What’s the difference between a population of people with a genetic disorder and another species?
selection
I told you. I said it day 1. Mugabe loves beloved maybe even more than RR which is something. Those naked black men pics. The constant refusal to say blacks were dumber than jews. I said it DAY ONE. Its just his ‘explanations’ are much more high IQ than loaded.
But when you boil it down. If a person has the psychological tempermant to believe in supernatural superhero jewish cult leaders….then they are going to believe in beloved or whatever prevailing religion is there.
We need a SEPERATE blog for religious people. Everyone else can then finally discuss science without trolling and stupid ‘arguments’ from jewish writers.
LOADED is the highest IQ commenter this blog has ever had.
LOADED is the highest IQ commenter this blog has ever had.
because peepee’s new even more retarded blog there’s some black penis hanging over the “name” part.
bartles & james is like Thirty Something.
how? peepee has no idea because has never left uttar pradesh.
SAD!
Mugabe doesnt want to openly say it. But he believes in the blank slate. And everyone holding hands and singing around a jewish preacher.
^^^YET TO REALIZE HE’S FULL-BLOWN AUTISTIC AND RETARDED!^^^
SAD!
Damn, Mugabe is killing it right now.
He’s just saying the objective truth about phenotypic expression, and yet it’s so controversial to people with an agenda.
He’s not really saying anything most of us don’t unuhstand and don’t already know, except unsubstantiated claims about racial or ancestral potentials (call that “genetic”) being equal for intelligence.
The only thing he’s killing is his gut biome with ethanol
“except unsubstantiated claims about racial or ancestral potentials”
The irony.
Low IQ^
Pete Buttigieg is so articulate and intelligent. I would vote for him in a heartbeat.
I would also vote for a Bernie/AOC ticket, I wish he’d run again, but idk if America would go for it, he’s basically already lost twice.
Never vote for shape operators or wordcels. You gotta get someone who is between. Pretty sure both of them are wordcels.
but peepee = lurker’s totally LOWER CLASS take on drinking brings up ANOTHER example.
THE EFFECT OF ETHANOL ON THE BRAIN AND THE BODY, VARIOUS ORGANS.
THESE ARE ABSURDLY VARIABLE.
(((pill))): muh genes n shit muhfugguh.
mugabe: YES! at least partially correct. AND THIS IS NOT CONTROVERSIAL!
BUT THE BIGGEST ESTABLISHED FACTOR (EXCLUDING THE RARE FLUSHING REACTION) IS NUTRITION.
ALL OF THE PROBLEMS “CAUSED” BY ALCOHOLISM (EXCEPT ONE) ARE ULTIMATELY DOWN TO THE FACT THAT ALCOHOLICS EAT POORLY IF AT ALL AND OBVIOUSLY/PROBABLY DON’T TAKE THIAMINE SUPPLEMENTS OR ANY OTHER SUPPLEMENT.
EXCEPT ONE = ALCOHOLISM HAS A CLEAR LINK TO CANCERS OF THE MOUTH AND THROAT. BUT EVEN THIS IS ABSURDLY VARIABLE.
AND ONLY THEN VIA IT’S METABOLYTE ACETALDAHYDE. ETHANOL PER SE IS NOT A CARCINOGEN. IT’S JUST A SOURCE OF CALORIES.
SO THE RIGHT WAY OF THINKING OF ALCOHOLISM IS…
IT’S LIKE IF COCA-COLA STILL HAD COCAINE IN IT…
AND PIPO BECAME ADDICTED…
AND CONSUMED LITTLE ELSE.
THE LEADING CAUSE OF CIRRHOSIS OF THE LIVER IS NOT ALCOHOL OR HEPATITIS. IT’S OBESITY AND FIZZY DRINKS.
ALCOHOL VS TOBACCO
MAKES PIPO CRAYCRAY VS ENHANCES THEIR COGNITIVE PERFORMACE.
YUGE SUPPOSED “SOCIAL COST” BECAUSE CRAYCRAY VS ACTUALLY YUGE AND UNAVOIDABLE MEDICAL COSTS
I SMOKED NOT MUCH, BECAUSE I WAS SUICIDAL, FOR A YEAR AND A HALF. IT WAS HARD TO QUIT. LIKE VERY. WAAAAAAAAY HARDER THAN QUITTING ALCOHOL.
CLASS VS ALCOHOL VS TOBACCO
SOME PIPO OF ALL CLASSES SMOKE AND DRINK. BUT WITH ALCOHOL THERE IS A POSITIVE CORRELATION AND WITH TOBACCO A NEGATIVE CORRELATION AT LEAST IN THE US AND THE UK.
palatial! 26 2025 Does this tiny island debunk the black-white IQ gap? Revisiting the Bermuda debate brilliant